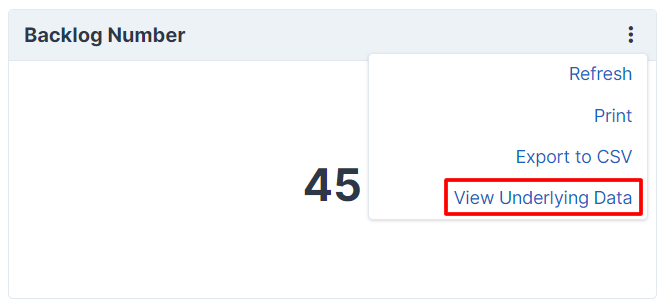
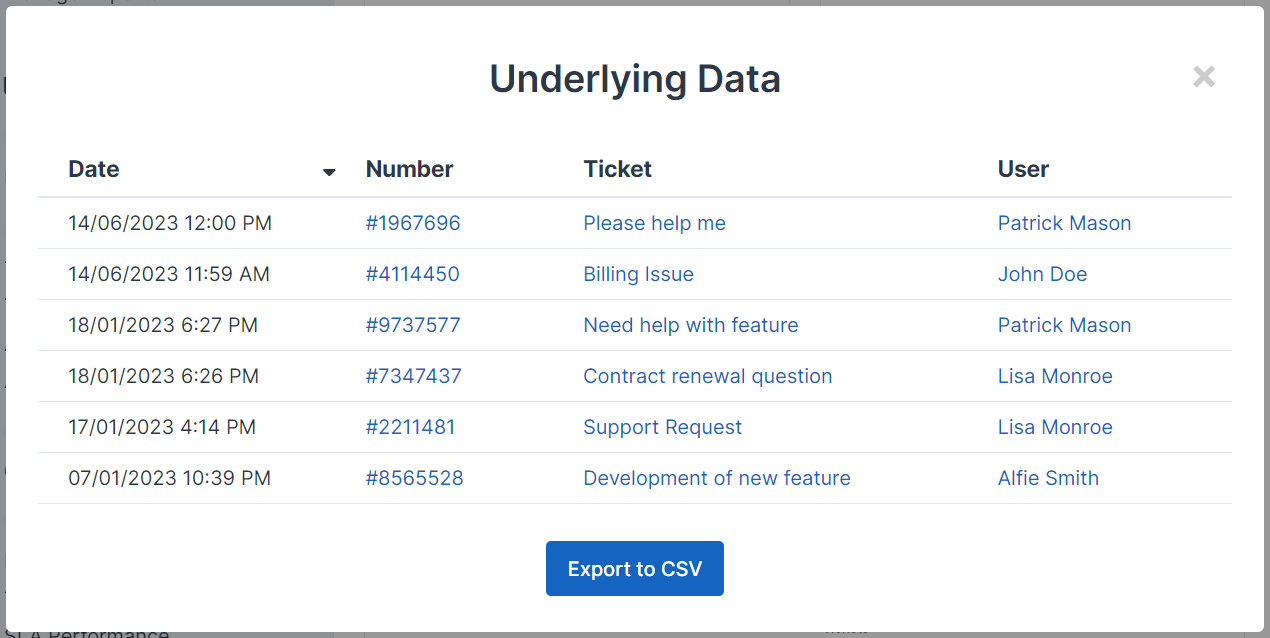
Underlying Data
A common scenario where this is useful is if your report relates to a number of tickets. The underlying data option will let you display a list of the specific tickets the data in the card relates to. You have full control on the columns and data shown, and it can be used outside of tickets too.
Implementing Underlying Data
To enable the "View underlying data" option, your card must implement the \App\Modules\Report\Addon\Dashboards\Cards\UnderlyingData interface. The card will then need to implement two methods, underlyingDataQuery and underlyingDataTableColumns.
Query
The query will usually be similar to your main card query. With a HTML or number card where there is usually just one data point, it may be the exact same query.
public function underlyingDataQuery(\App\Http\Requests\Request $request): \Illuminate\Database\Eloquent\Builder
{
    return QueryBuilder::for(Ticket::class)
        ->applyFilters($this->dashboard()->filters('ticket.created_at'))
        ->where('ticket.status_id', '<>', Config::get('settings.default_resolved_status'))
        ->where('ticket.last_reply_time', '<', now()->subDays(7)->getTimestamp())
        ->select('ticket.*');
}
Drill Into
You might be interested to see the underlying data for a specific data point, be it clicking on a point in a chart card or a row in a table card, you can do this with drilling into the underlying data.

The underlyingDataQuery method contains the request data as a parameter, this will contain the data point data, such as label and value. We can apply these to filter our query more specifically.
public function underlyingDataQuery(\App\Http\Requests\Request $request): \Illuminate\Database\Eloquent\Builder
{
    $query = QueryBuilder::for(Ticket::class)
        ->applyFilters($this->dashboard()->filters('ticket.created_at'))
        ->where('ticket.status_id', '<>', Config::get('settings.default_resolved_status'))
        ->where('ticket.last_reply_time', '<', now()->subDays(7)->getTimestamp());

    if ($request->has('value')) {
        $query->where('ticket.department_id', $request->integer('value'));
    }

    return $query->select('ticket.*');
}
The data in the request will vary depending on the chart type or table data. Most requests will usually contain a value field, charts will usually additionally contain a label field too. The value field may be split if there are multiple axes, for example value.x and value.y such as in a stacked line graph.
Value Key
If we're using string names in our charts (custom object dataset) or have multiple columns in our table, it's not always obvious what we want to filter by when we're drilling into and this is where the value key is important. It defaults to the id attribute by default, but for a table that is split by department, we usually want to use department_id attribute as the value for the row.
public function getUnderlyingDataValueKey(): string
{
    return 'department_id';
}
Table Columns
The underlyingDataTableColumns method must return an array of \App\Modules\Report\Addon\Dashboards\Cards\Table\Column instances.
Available Columns
A number of predefined columns are available that you can use directly in your underlying data table.
| Column | Class | Example Output |
|---|---|---|
| Self-Service | ||
| Article Date | \App\Modules\Report\Addon\Dashboards\UnderlyingData\Columns\Selfservice\ArticleCreatedAtColumn |
25/01/2023 4:00 PM |
| Article Title | \App\Modules\Report\Addon\Dashboards\UnderlyingData\Columns\Selfservice\ArticleTitleColumn |
This is an Article Title |
| Article Feedback Rating | \App\Modules\Report\Addon\Dashboards\UnderlyingData\Columns\Selfservice\FeedbackRatingColumn |
Good |
| Article Feedback Date | \App\Modules\Report\Addon\Dashboards\UnderlyingData\Columns\Selfservice\FeedbackUpdatedAtColumn |
25/01/2023 4:00 PM |
| Article Feedback View | \App\Modules\Report\Addon\Dashboards\UnderlyingData\Columns\Selfservice\FeedbackViewColumn |
|
| Ticket | ||
| Ticket Feedback Rating | \App\Modules\Report\Addon\Dashboards\UnderlyingData\Columns\Ticket\FeedbackRatingColumn |
Good |
| Ticket Feedback Date | \App\Modules\Report\Addon\Dashboards\UnderlyingData\Columns\Ticket\FeedbackUpdatedAtColumn |
25/01/2023 4:00 PM |
| Ticket Feedback View | \App\Modules\Report\Addon\Dashboards\UnderlyingData\Columns\Ticket\FeedbackViewColumn |
|
| Ticket Brand | \App\Modules\Report\Addon\Dashboards\UnderlyingData\Columns\Ticket\TicketBrandColumn |
ACME Limited |
| Ticket Channel | \App\Modules\Report\Addon\Dashboards\UnderlyingData\Columns\Ticket\TicketChannelColumn |
Web |
| Ticket Created Date | \App\Modules\Report\Addon\Dashboards\UnderlyingData\Columns\Ticket\TicketCreatedAtColumn |
25/01/2023 4:00 PM |
| Ticket Department | \App\Modules\Report\Addon\Dashboards\UnderlyingData\Columns\Ticket\TicketDepartmentColumn |
Support |
| Ticket Number | \App\Modules\Report\Addon\Dashboards\UnderlyingData\Columns\Ticket\TicketNumberColumn |
#123456 |
| Ticket Priority | \App\Modules\Report\Addon\Dashboards\UnderlyingData\Columns\Ticket\TicketPriorityColumn |
Low |
| Ticket Reopened Date | \App\Modules\Report\Addon\Dashboards\UnderlyingData\Columns\Ticket\TicketReopenedTimeColumn |
25/01/2023 4:00 PM |
| Ticket Resolved Date | \App\Modules\Report\Addon\Dashboards\UnderlyingData\Columns\Ticket\TicketResolvedTimeColumn |
25/01/2023 4:00 PM |
| Ticket Status | \App\Modules\Report\Addon\Dashboards\UnderlyingData\Columns\Ticket\TicketStatusColumn |
Open |
| Ticket Subject | \App\Modules\Report\Addon\Dashboards\UnderlyingData\Columns\Ticket\TicketSubjectColumn |
Ticket Subject |
| Ticket Tags | \App\Modules\Report\Addon\Dashboards\UnderlyingData\Columns\Ticket\TicketTagsColumn |
Tag One, Tag Two |
| Ticket User Name | \App\Modules\Report\Addon\Dashboards\UnderlyingData\Columns\Ticket\UserFormattedNameColumn |
John Doe |
| User | ||
| User Country | \App\Modules\Report\Addon\Dashboards\UnderlyingData\Columns\User\UserCountryColumn |
United Kingdom |
| User Created Date | \App\Modules\Report\Addon\Dashboards\UnderlyingData\Columns\User\UserCreatedAtColumn |
25/01/2023 4:00 PM |
| User Name | \App\Modules\Report\Addon\Dashboards\UnderlyingData\Columns\User\UserFormattedNameColumn |
John Doe |
The below example uses a few of these columns.
public function underlyingDataTableColumns(): array
{
    return [
        new \App\Modules\Report\Addon\Dashboards\UnderlyingData\Columns\Ticket\TicketCreatedAtColumn,
        new \App\Modules\Report\Addon\Dashboards\UnderlyingData\Columns\Ticket\TicketNumberColumn,
        new \App\Modules\Report\Addon\Dashboards\UnderlyingData\Columns\Ticket\TicketSubjectColumn,
        new \App\Modules\Report\Addon\Dashboards\UnderlyingData\Columns\Ticket\UserFormattedNameColumn,
    ];
}
Custom Columns
If one of the above columns doesn't fit your requirements, you can define your own column in the same way as you would in a table card.
$column = (new \App\Modules\Report\Addon\Dashboards\Cards\Table\Column('Date'))
    ->setId('date')
    ->setDefinition(['width' => '180px'])
    ->setValue(function ($model) {
        return formatDate($model->created_at);
    });
Table Options
The table is loaded using Datatables, should you need to change any of the default options you can declare this using the underlyingDataTableOptions method.
public function underlyingDataTableOptions(): array
{
    return ['ordering' => false];
}
Examples
Example - HTML Card
<?php declare(strict_types=1);

namespace Addons\Reports\TicketBacklog\Reports\Cards\Overview;

use App\Http\Requests\Request;
use App\Modules\Report\Addon\Dashboards\Cards\NumberCard;
use App\Modules\Report\Addon\Dashboards\Cards\UnderlyingData;
use App\Modules\Report\Addon\Dashboards\Filtering\QueryBuilder;
use App\Modules\Report\Addon\Dashboards\UnderlyingData\Columns\Ticket\TicketCreatedAtColumn;
use App\Modules\Report\Addon\Dashboards\UnderlyingData\Columns\Ticket\TicketNumberColumn;
use App\Modules\Report\Addon\Dashboards\UnderlyingData\Columns\Ticket\TicketSubjectColumn;
use App\Modules\Report\Addon\Dashboards\UnderlyingData\Columns\Ticket\UserFormattedNameColumn;
use App\Modules\Ticket\Models\Ticket;
use Illuminate\Database\Eloquent\Builder;
use Illuminate\Support\Facades\Config;

class BacklogNumber extends NumberCard implements UnderlyingData
{
    protected int $width = 4;

    public function name(): string
    {
        return 'Backlog Number';
    }

    public function number(): ?float
    {
        return $this->baseQuery()->count();
    }

    protected function baseQuery(): Builder
    {
        return QueryBuilder::for(Ticket::class)
            ->applyFilters($this->dashboard()->filters('ticket.created_at'))
            ->where('ticket.status_id', '<>', Config::get('settings.default_resolved_status'));
    }

    public function underlyingDataQuery(Request $request): Builder
    {
        return $this->baseQuery()->select('ticket.*');
    }

    public function underlyingDataTableColumns(): array
    {
        return [
            new TicketCreatedAtColumn,
            new TicketNumberColumn,
            new TicketSubjectColumn,
            new UserFormattedNameColumn,
        ];
    }
}
Example - Chart Card (with Drill Into)
<?php declare(strict_types=1);

namespace Addons\Reports\TicketBacklog\Reports\Cards\Overview;

use App\Http\Requests\Request;
use App\Modules\Report\Addon\Dashboards\Cards\Chart\ChartType;
use App\Modules\Report\Addon\Dashboards\Cards\Chart\Datasets\CustomObjectDataset;
use App\Modules\Report\Addon\Dashboards\Cards\Chart\DataStructure;
use App\Modules\Report\Addon\Dashboards\Cards\ChartCard;
use App\Modules\Report\Addon\Dashboards\Cards\UnderlyingData;
use App\Modules\Report\Addon\Dashboards\Filtering\QueryBuilder;
use App\Modules\Report\Addon\Dashboards\UnderlyingData\Columns\Ticket\TicketCreatedAtColumn;
use App\Modules\Report\Addon\Dashboards\UnderlyingData\Columns\Ticket\TicketNumberColumn;
use App\Modules\Report\Addon\Dashboards\UnderlyingData\Columns\Ticket\TicketSubjectColumn;
use App\Modules\Report\Addon\Dashboards\UnderlyingData\Columns\Ticket\UserFormattedNameColumn;
use App\Modules\Ticket\Models\Ticket;
use Illuminate\Database\Eloquent\Builder;
use Illuminate\Support\Facades\Config;

use function trans_choice;

class BacklogByPriorityChart extends ChartCard implements UnderlyingData
{
    protected int $width = 6;

    public function name(): string
    {
        return 'Backlog By Priority';
    }

    public function data(): DataStructure
    {
        $data = $this->baseQuery()
            ->join('ticket_priority', 'ticket_priority.id', '=', 'ticket.priority_id')
            ->groupBy('ticket.priority_id')
            ->select('ticket_priority.name', 'ticket.priority_id')
            ->selectRaw('COUNT(*) as aggregate')
            ->orderBy('ticket_priority.order')
            ->getQuery()
            ->get();

        $dataset = new CustomObjectDataset($data->map(fn($v) => (array) $v)->all(), 'aggregate', 'name');

        return (new DataStructure(ChartType::BAR, $dataset))
            ->setLabels($data->pluck('name')->toArray())
            ->setAxisNames(trans_choice('ticket.ticket', 2), trans_choice('ticket.priority', 1))
            ->setOptions([
                'indexAxis' => 'y',
                'plugins' => [
                    'legend' => ['display' => false]
                ],
                'scales' => [
                    'x' => [
                        'ticks' => ['precision' => 0],
                    ],
                ]
            ]);
    }

    protected function baseQuery(): Builder
    {
        return QueryBuilder::for(Ticket::class)
            ->applyFilters($this->dashboard()->filters('ticket.created_at'))
            ->where('ticket.status_id', '<>', Config::get('settings.default_resolved_status'));
    }

    public function underlyingDataQuery(Request $request): Builder
    {
        $query = $this->baseQuery();

        if ($request->has('value')) {
            $query->where('ticket.priority_id', $request->integer('value'));
        }

        return $query->select('ticket.*');
    }

    public function underlyingDataTableColumns(): array
    {
        return [
            new TicketCreatedAtColumn,
            new TicketNumberColumn,
            new TicketSubjectColumn,
            new UserFormattedNameColumn,
        ];
    }

    public function getUnderlyingDataValueKey(): string
    {
        return 'priority_id';
    }
}
Article Number: 241
Author: Jul 22, 2024
Last Updated: Jul 22, 2024
Online URL: https://docs.supportpro.vn/article/underlying-data-241.html